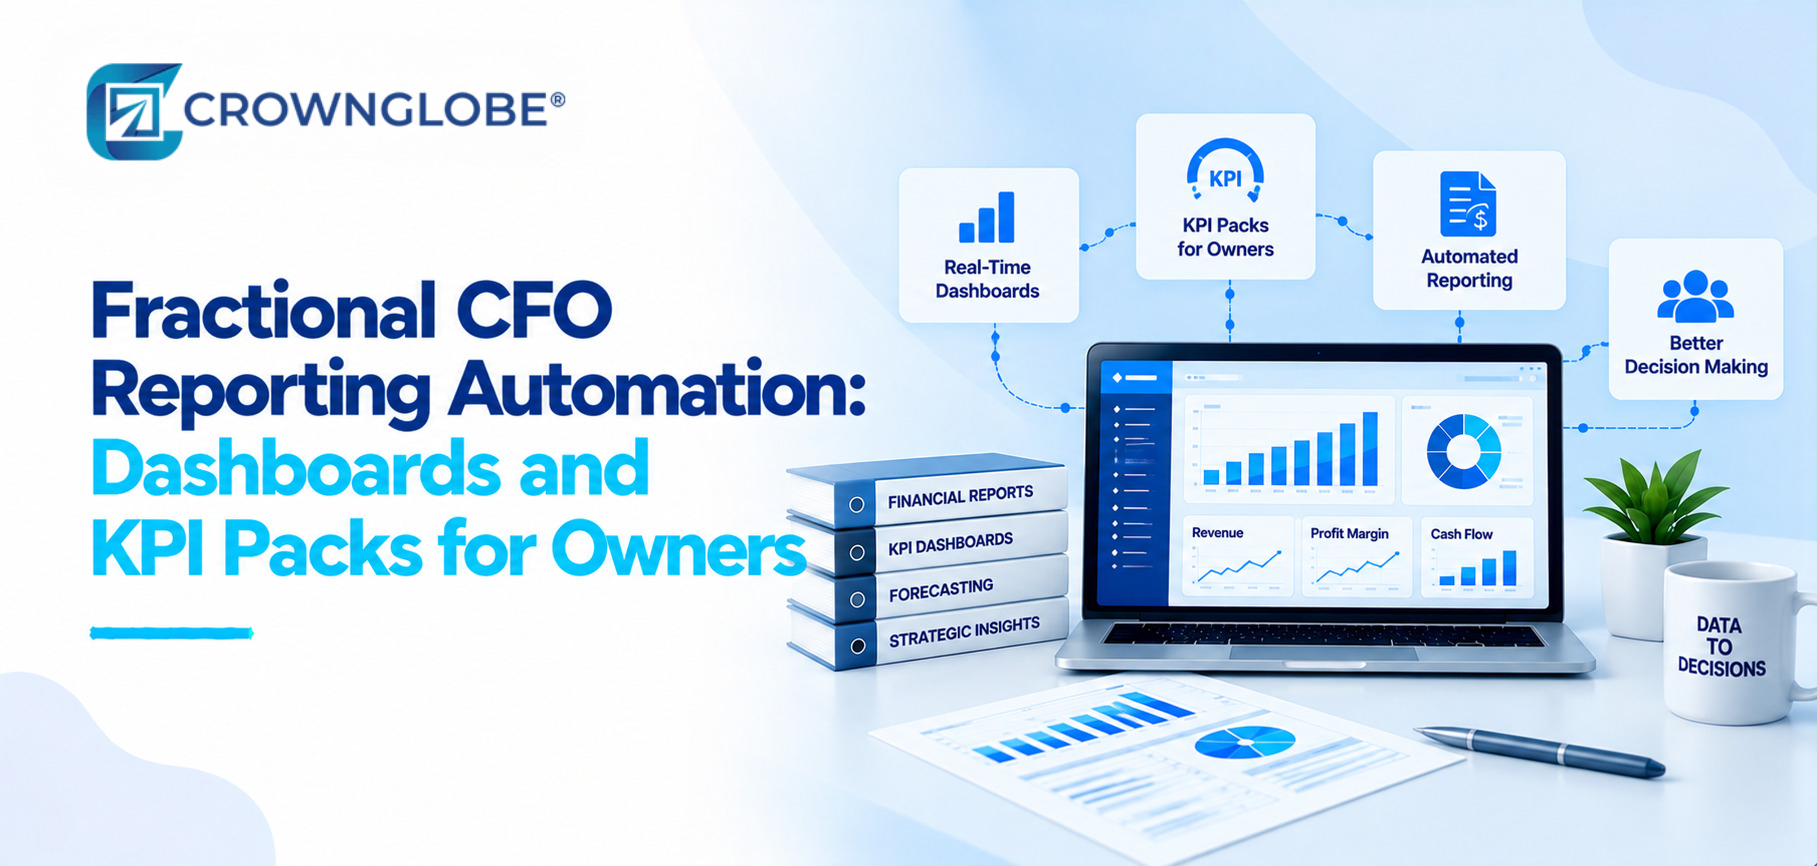
Fractional CFO client reporting automation should begin with the owner’s decisions, not with a dashboard. Connect data to carefully controlled KPIs, then set up updates, forecasts and regular management packs.
The goal is to manage data movement and regular reporting so the CFO can concentrate on variance analysis, cash flow, forecast changes and key decisions.
Five Layers, Bottom to Top
Every reporting system begins with the places where the numbers originate: accounting software, bank data, payroll, billing, CRM, ecommerce, or other operating systems.
The first question is not simply, “Can we connect it?” A better question is, “Do we trust the underlying data enough to report from it?” Automation cannot make incomplete or unreconciled information reliable.
Before an owner sees a KPI, all reporting dimensions like accounts, entities, departments, dates, products and locations must be mapped in the way, for the KPI.
Repeatable transformations can be automated,. Reconciliation and exception handling remain very important; a reporting workflow should expose accounting questions than hiding them inside dashboard logic.
A useful KPI pack needs more, than formulas; each KPI metric should have a definition, a known source, an owner and a management question attached to it.
The model should focus on the decisions management needs to make including budget, versus forecast assumptions cash flow drivers, business unit views and comparison periods not just the amount of data available.
In the reporting layer you will see revenue, margin, cash, runway, budget, versus actual, receivables, working capital indicators and operating KPIs that matter to the business.
A dashboard is helpful when it shows what's different and what’s changing. It gets hard to understand when everything seems important and the math isn't clear.
This is where reporting becomes financial leadership. The fractional CFO should explain variances update the forecast connect results to cash, test scenarios and turn discussion into actions.
For businesses evaluating Virtual CFO services, that is the difference between receiving a report and having a recurring financial decision process.
Start From the Questions, Not the Data
Different businesses need measures. Revenue and cash matter broadly but the operating drivers, behind them can vary significantly. That is why finance reporting needs by business model should shape the dashboard before the dashboard shapes the conversation.
What changed from plan?
Start with the budget. Focus the report, on variances that need management’s attention, not every line item.
Identify which changes must be examined, which assumptions must be revised and which responses must be applied.
Where is cash headed?
Historical data gives a small part of the picture owners also need to look ahead at collections, spending, debt, investments and other important cash obligations.
This is where fractional CFO services and cash flow planning should naturally connect with the reporting pack. CrownGlobe's guide to cash flow management provides additional context.
Which KPI needs management attention?
A useful reporting pack makes exceptions easier to spot. It should not try to show many KPIs on the screen.
Focus on measures that show a decision, risk or opportunity.
What decision needs to change?
Reporting must result in action. Can affect decisions such, as hiring and pricing and spending and collections and inventory and financing.
When evaluating fractional CFO companies, find out how their reporting process links data to management decisions because a good dashboard alone is not enough without a clear decision-making rhythm.
For founders preparing for investors or a board, see CrownGlobe's guide to fractional CFO reporting and board decision support.
Four Phases, in Order
Phase 1 Define decisions and KPI definitions
Start with the reporting audience the questions they need. The cadence of those decisions and define the core KPIs before building visualizations so the organization works from one agreed interpretation of each measure.
Phase 2 Map sources and controls
Record every input source, every input owner, every input mapping and every input reconciliation. Decide which dimensions department, location, product or customer segment must stay the same across the reporting model dimensions.
Phase 3 Build the reporting model and pack
Build the model KPI logic, dashboard views, forecast components and management pack based on the agreed definitions. A structured fact and dimension model in Power BI helps users, with filtering and clearer summarization when the data is designed properly.
Phase 4 Test, reconcile and establish the operating cadence
Before the reporting pack becomes routine make key outputs match source records test how the data refreshes, check for any issues and give someone responsibility. Management needs to be able to track a number back, to where it came from and see what happens next when it changes.
Refresh Configuration: Two Speeds, Clearly Labeled
Fresh data is not the same, as management reporting. Some data updates often but decisions based on it are made weekly, monthly or quarterly.
| Reporting element | Source | Refresh approach | Owner | Validation step | Decision cadence |
|---|---|---|---|---|---|
| Cash / bank position | Banking and accounting data | Frequent where useful | Finance | Reconciliation / exception review | Operational |
| P&L / balance sheet | Accounting close | After books are sufficiently complete | Finance | Close / reconciliation | Monthly |
| KPI dashboard | Accounting + operating systems | Based on source availability | Finance / operations | Definition and source checks | Weekly / monthly |
| Forecast | Actuals + assumptions | Planned refresh | CFO / owner | Assumption review | Monthly / event-triggered |
| Owner KPI pack | Validated reporting model | Fixed management schedule | CFO | Management review | Monthly / quarterly |
Power BI can refresh data on a schedule. The timing depends on the data connection and model setup so it’s not real time and should match the decision maker’s needs and the source data’s stability.
What to Automate Beneath the Dashboard
Dashboard shows the output. The real value of the dashboard comes from repeatable work underneath repeatable work.
Scheduled data movement
Reliable connections help cut down on repeated export and copy tasks. Someone must still take responsibility when a connection fails or a source system changes.
Standard mappings and transformations
Validated rules help make recurring reports more consistent. Changes, to accounts, entities, products or reporting dimensions still need careful review instead of being accepted automatically.
Exception and data-quality checks
Automation is most useful when it shows missing information instead of quietly sending the data forward.
Recurring report distribution and alerts
A reporting workflow can schedule the distribution of management packs and helpful alerts. Deciding what to do with the information still requires a human decision.
For a broader framework on what to automate and what to keep manual, separate repeatable processing from the judgment that belongs with finance leadership.
The Schedule That Keeps It Trusted
A reporting system requires upkeep and has to have a clear person or team responsible, for it.
Why CFO Dashboards Get Abandoned
- 1. The underlying books are not trusted Even a tidy dashboard cannot fix accounting or reconciliation issues that're still unresolved.
- 2. Too many KPIs compete for attention When everything feels important the reporting pack fails to help management focus on what needs attention first.
- 3. Metric definitions change without governance If different teams calculate the key performance indicator in different ways trust, in the reports can disappear fast.
- 4. Nobody owns refresh or reconciliation A reporting system that has no named owner eventually becomes stale, inconsistent or both.
- 5. The dashboard reports history but does not support a decision If management only gets information, about what happened and not what needs to be reviewed or changed next they may stop using the pack.
- 6. Broken source mappings or refresh failures go unnoticed Automation only reduces work when the exceptions are clear and someone is responsible, for fixing them.
When owners ask,
The goal is not to replace judgment but to automate data tasks so that CFOs can devote time to interpretation, forecasting, cash planning and decision making.A good reporting system needs people to handle data and updates while financial teams manage definitions understand the data. Take action.
Questions Owners Ask About Fractional CFO Reporting Automation
It should include the financial and operating measures that support recurring owner decisions. Common examples include revenue, margin, cash, budget versus actual, forecast, receivables, working capital, and selected operating KPIs. The exact set should fit the business model.
Start with reliable source data and controlled mappings, define KPI logic, build the reporting model, configure appropriate refreshes, reconcile outputs, and establish a review cadence. Automate repeatable collection and presentation while keeping interpretation and decisions under human oversight.
There is no single correct frequency. Operational data may update frequently, while financial statements and owner packs should follow the close, reconciliation, forecast, and management-review cadence. Refresh frequency should match the source data and the decision being made.
No. Automation can reduce repetitive collection, transformation, distribution, and monitoring. A fractional CFO still interprets results, challenges assumptions, updates forecasts, evaluates cash implications, models scenarios, and helps management decide what to do next.
Cost depends on scope, business complexity, reporting requirements, forecasting needs, meeting cadence, and senior financial involvement. Compare the specific deliverables and access included rather than relying on one market-wide headline number.
The reporting system should connect historical results with forward cash assumptions. The dashboard can surface the signals while the CFO reviews assumptions, scenarios, and management responses.
Sources & Further Reading
- Microsoft Understand star schema and the importance for Power BI. learn.microsoft.com/en-us/power-bi/guidance/star-schema
- Microsoft Data refresh in Power BI. learn.microsoft.com/en-us/power-bi/connect-data/refresh-data
- Microsoft Configure scheduled refresh. learn.microsoft.com/en-us/power-bi/connect-data/refresh-scheduled-refresh
- Hobasa Fractional CFO Client Reporting Automation. hobasa.com/blog/fractional-cfo-client-reporting-automation
- CompassPoint Tech-enabled CFO-Level Reporting & Dashboards. compasspoint-consulting.com/tech-enabled-cfo-level-reporting-dashboards
General information disclaimer: This article is for general business information and does not constitute accounting, financial, investment, tax, legal, or technology advice. Reporting requirements, KPI definitions, data architecture, and fractional CFO scope vary by business, systems, and engagement.
Confirm material financial decisions with the appropriate qualified professionals for your circumstances.
Build a Reporting System Owners Can Actually Use
A useful KPI pack should connect trusted data, consistent definitions, an appropriate refresh cadence, and a recurring management discussion. The operating model matters more than the technology.
Talk with CrownGlobe about the reporting your owners and leadership team need, the manual work behind it, and where Virtual CFO support can improve the recurring decision process.