Master Your Data with Power BI Visualization
Turn complex numbers into instant insights.
Crownglobe makes custom Power BI dashboards for your business that show you things, like how much money you are making and where you are spending it.
Why Power BI Dashboards Matter
Businesses often struggle with disconnected financial data, slow reporting processes, and limited visibility into business performance. Important insights remain buried in spreadsheets, making it difficult for leadership teams to make fast and informed decisions. Crownglobe’s Power BI Visualization services bring financial, accounting, and operational data into unified dashboards with automated reporting, interactive visuals, and real-time KPI tracking to help businesses improve reporting accuracy, financial visibility, and strategic decision-making.
- Data scattered: Financial data in Excel, accounting software and operations systems is separate and not up-, to-date.
- Slow reporting: Manual report generation eats up weeks each month.
- Lack of insights: Important information, like trends and variances are hidden in spreadsheets and management cannot see them.
- Inaccurate reporting: Disconnected financial systems and outdated records create errors and reduce financial visibility.
- Decision delays: Hidden financial trends and slow reporting make it difficult for management to make timely business decisions.

- Unified Dashboards: We put all data sources into one Power BI dashboard so the numbers update automatically away.
- Automated Reports: Power BI makes reports like cashflow, budgets and KPIs, on a schedule so your team has more free time.
- Interactive Visuals: Drill down into the charts and maps to quickly find issues, like department overspending and low-margin customers.
- Unified dashboards: We connect multiple data sources into centralized Power BI dashboards with automatic real-time updates.
- Automated insights: Interactive reports and visual analytics help businesses track KPIs, monitor budgets, and quickly identify financial issues or performance trends.

Power BI Services
We build Power BI reporting systems that turn financial and operational data into clear dashboards, automated reports, and actionable business insights. Our solutions help businesses improve visibility and make faster, data-driven decisions with confidence.
Our team develops custom dashboards for financial, sales, operational, and executive reporting while integrating data across accounting, ERP, CRM, and payroll systems. We also automate reporting workflows, scheduled data refreshes, and real-time performance tracking.
With advanced analytics, forecasting tools, and AI-powered insights, we help businesses gain deeper visibility into performance trends and financial operations. Our goal is to create scalable reporting systems that support smarter planning, efficiency, and long-term business growth.

Dashboard Development:
We can create Custom Power BI dashboards, like executive, financial and operational ones that are built to meet your needs. (E.g. I need a tool that includes a Sales Dashboard and a Cashflow Tracker to compare my Budget versus expenses.

Data Integration & ETL:
You can connect your accounting and ERP and payroll and CRM systems to Power BI with automated ETL pipelines so that your accounting and ERP and payroll and CRM data is clean and linked and updated every hour or every day.

Self-Service Reporting Training:
We help your staff learn Power BI Desktop and mobile apps with hands-on training so they can make their reports.

Advanced Analytics:
You can use Power BIs artificial intelligence features like Quick Insights and Forecasting to find patterns and answer business questions in a way.
Benefits

Real-Time Financial Insights
Up-to-the-minute dashboards show actual vs target, eliminating guesswork. “Our client cut budget reviews by 75% after dashboard automation,” says Crownglobe analyst.

Faster Reporting
Automated Power BI reports save us weeks every quarter by freeing up fifty percent of our close time.

Increased Profitability
Visualizing margins and costs helps clients to make profit by showing where they are wasting money. (E.g. The company found a product line that was not making money and it actually cut their annual profit by 5 percent.

Enhanced Collaboration
You can share Power BI reports with board members and remote managers to get everyone on the same page, with Power BI reports.

Trusted by Industry
Crownglobe delivers Power BI for over 100 U.S. SMBs. Our dashboards are used by executives, investors, and lenders to validate growth plans.
Power BI Dashboard Process Timeline
Our Power BI implementation process helps businesses transform disconnected financial data into clear, automated, and interactive dashboards. From data analysis and dashboard design to deployment and ongoing support, we build reporting systems that improve visibility and decision-making.
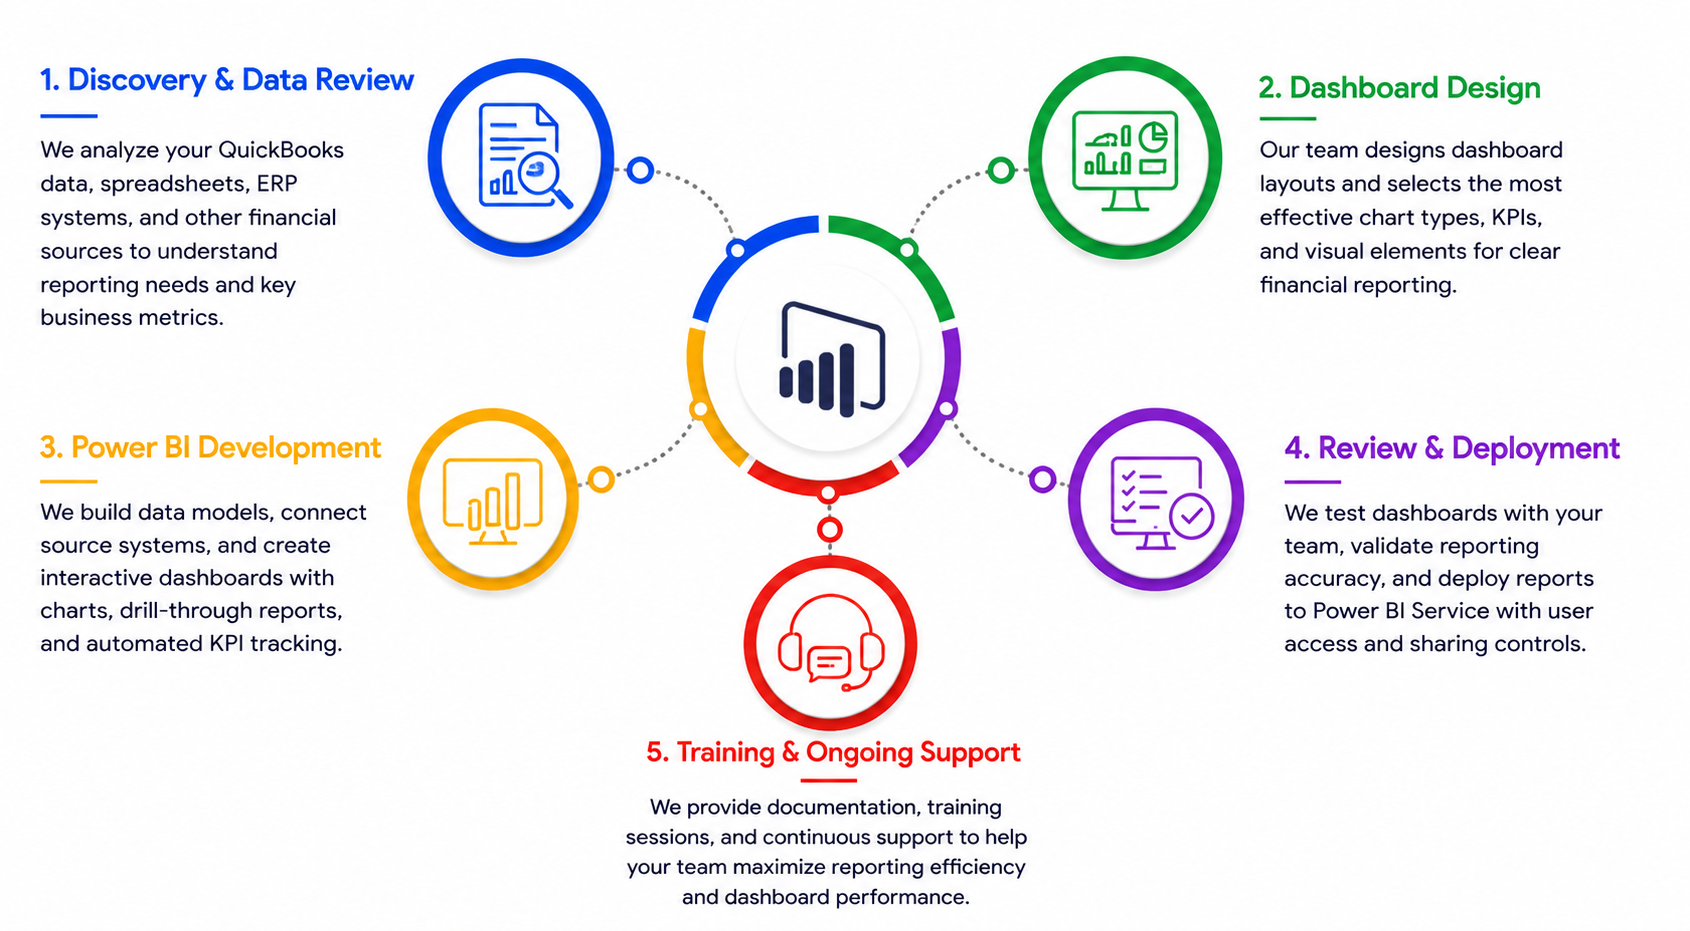
Discovery & Data Review
We analyze your QuickBooks data, spreadsheets, ERP systems, and other financial sources to understand reporting needs and key business metrics.
Dashboard Design
Our team designs dashboard layouts and selects the most effective chart types, KPIs, and visual elements for clear financial reporting.
Power BI Development
We build data models, connect source systems, and create interactive dashboards with charts, drill-through reports, and automated KPI tracking.
Review & Deployment
We test dashboards with your team, validate reporting accuracy, and deploy reports to Power BI Service with user access and sharing controls.
Training & Ongoing Support
We provide documentation, training sessions, and continuous support to help your team maximize reporting efficiency and dashboard performance.
Case Study

Turning Data into Growth Opportunities
A growing retail chain was collecting large volumes of sales data but struggled to turn it into actionable business insights. Crownglobe developed customized Power BI dashboards tailored to the company’s operational and financial goals. The dashboards provided clear visibility into sales trends, inventory performance, and key profit drivers across locations. Real-time reporting enabled managers to identify opportunities, address inefficiencies, and make data-driven decisions more quickly. Interactive visualizations simplified complex data and improved performance monitoring throughout the organization. As a result, leadership gained comprehensive, real-time visibility into operations and strengthened overall business performance.
FAQs
Power BI is Microsoft’s cloud-based business analytics service for creating interactive reports and dashboards from multiple data sources. It simplifies connecting to accounting, ERP, CRM, and Excel data and visualizes key business metrics. Power BI lets even non-technical users explore financial trends without manual reports.
We use Power BI’s built-in connectors and ETL (Power Query) to link your accounting software (e.g. QuickBooks Online, Xero, Sage) and other systems. Sales, expenses, and general ledger data flow into Power BI automatically. This eliminates manual data entry errors and ensures your dashboards are always up-to-date with the latest transactions.
Virtually any KPI or trend can be visualized. Common examples include revenue vs. target dashboards, cash flow trackers, budget vs. actual reports, and departmental P&L analyses. We tailor charts (bar/line charts, gauges, maps, etc.) to highlight your top metrics. For instance, restaurant owners might see daily sales and food cost %; hotel managers see occupancy and RevPAR; retailers see inventory levels and margin by category.
Power BI is built on Azure and offers enterprise-grade security. Data in Power BI is encrypted in transit and at rest, and access is controlled by role-based permissions. It meets common compliance standards (SOC 2, HIPAA, FedRAMP, etc.). Only authorized users see your financial data, and admin can audit who views or exports reports.
No coding is needed for everyday reporting. Power BI’s drag-and-drop interface and natural language Q&A make it user-friendly. Our team handles the initial setup and data modeling, and we train your staff. After deployment, business users can filter data, drill into visuals, or even create simple reports on their own with minimal IT involvement.
Yes. Power BI offers native mobile apps for iOS and Android, and web access via browser. You and your team can view and interact with dashboards securely on smartphones or tablets, keeping you informed on-the-go (e.g. CEOs monitoring daily metrics from anywhere).
A typical initial dashboard project takes 4–6 weeks, depending on complexity. This covers requirements, design, data integration, and testing. Once live, new dashboards or changes can often be delivered in days as part of ongoing support.
Companies frequently see major time savings. For example, finance teams report reducing close cycles from weeks to days by replacing manual Excel work with automated Power BI reports. Managers spot issues sooner (e.g. a spike in overtime pay) and correct them, improving margins. The exact ROI depends on your business, but many clients recover their BI investment within the first few months through efficiency gains.
Basic familiarity with data (sorting/filtering in Excel) is helpful. After launch, business users can interact with dashboards and ask questions via the Power BI interface. We train at least one “Power BI champion” at your organization who can tweak reports or build new visuals over time.
Absolutely. Power BI visuals are interactive. For example, you can click on a bar in a sales chart to see a breakdown by product or region. This drill-through capability helps you quickly identify root causes of trends or variances without exporting data to spreadsheets.
We handle the heavy lifting. Our service includes ETL (“extract-transform-load”) to clean and merge data. If needed, we perform any data cleanup or reconciliation tasks (e.g. mapping GL accounts). This ensures your Power BI reports always reflect accurate, consolidated information.
We configure scheduled refreshes in Power BI Service (hourly, daily, or weekly). For most accounting data, a nightly refresh is common. You can also trigger on-demand refreshes as needed. Once set up, the process is automatic and requires no manual intervention.
Under our subscription or dedicated-team plans, we continuously update and improve your analytics. You can request new visuals (e.g. “Add COGS by supplier”) or additional data sources (e.g. payroll system) as your business grows. We ensure the dashboards evolve alongside your needs.
Yes. To share reports beyond a small proof of concept, Power BI Pro or Premium licenses are required. We can advise on licensing (e.g. Pro per user vs. Premium capacity) based on your team size and usage. Our subscription offerings can cover licensing administration for you.
Traditional reports are static snapshots, often delayed by manual processing. Power BI dashboards are dynamic and interactive. They let you explore data in real time. Instead of waiting weeks for a monthly report, executives can log in and see today’s performance. In short, Power BI turns your financial data into a living, visual resource for decision-making.
Accelerate Your Business Growth
Discover our core solutions designed to streamline your financial operations and branding.
Ready to see your numbers come to life?
Contact Crownglobe for a free Power BI visualization consultation. Let’s uncover insights that drive your business forward.
Book a Consultation