Running a gas station and convenience store today is no longer just about tracking daily sales. Whether you own a convenience store and gas station or manage locations the challenge is turning data into clear financial decisions based on your numbers.
Most operators already have Point of Sale systems, fuel reports, and accounting data, in place. The problem with these systems is that they usually work separately from each other like they are, in their little worlds these systems. You have a lot of data. It is not clear enough to help you make confident decisions about the data.
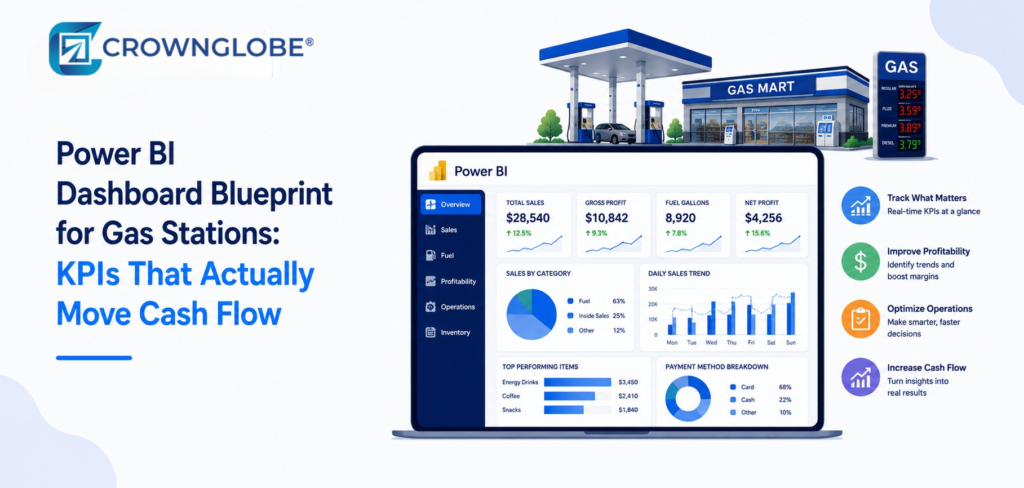
A structured Power BI dashboard that brings all your data together shows you what is really important and helps you focus on the key performance indicators that directly affect your cash flow.
Why Most Gas Station Reports Fail to Drive Decisions
Gas stations and convenience stores generate a constant flow of data every day.
You are tracking fuel sales, inside store revenue, lottery, tobacco, vendor rebates, and card transactions. Yet despite this volume, many business owners still feel they lack visibility.
The issue is not the data itself. It is how that data is organized and presented.
Common challenges include:
- Reports spread across multiple systems with no clear connection
- Limited real time visibility, especially across locations
- KPIs that are either unclear or not consistently tracked
- Financial insights that arrive too late to act on
Operating a convenience store and gas station with no structure makes it hard to make decisions on time, for your convenience store and gas station.
A made dashboard helps people understand things by changing raw data into useful information that they can use to make good decisions.
The KPI Framework That Actually Impacts Cash Flow
Not every number deserves your attention. A strong dashboard focuses only on the metrics that directly affect profitability in a gas station and convenience store, regardless of the difference between gas station and convenience store revenue streams.
Fuel Margin Per Gallon
Fuel drives volume but not always profit.
Your dashboard should clearly track:
- Cost per gallon
- Selling price
- Margin trends by supplier and over time
Even small improvements in fuel margin can have a meaningful impact on cash flow, particularly when evaluating a gas station and convenience store for sale in Florida or Texas.
Inside Store Gross Margin
Your convenience store is where most of your profits are generated.
Focus on:
- Category-level margins
- Performance of high-margin products
- Impact of promotions and pricing
For operators managing a chain of convenience stores and gas stations, this insight becomes essential for scaling profit across locations.
Labor Cost Percentage
Labor is one of the few areas where you have direct control.
Your dashboard should give you a clear view of:
- Labor as a percentage of sales
- Sales per labor hour
- Overtime patterns
When this data is aligned with payroll processing systems, it allows you to adjust staffing based on actual demand rather than assumptions.
Cash Over and Short Trends
Cash discrepancies may seem small. Can add up over time and hurt profitability.
Tracking these trends weekly helps you:
- Identify patterns across locations
- Address internal control gaps early
- Reduce unnecessary losses
This is especially important for operators expanding across states such as New Jersey, Pennsylvania, and Virginia.
Card Fee Impact
Card usage continues to grow, and with it, processing costs.
A strong dashboard should show:
- Fees as a percentage of total sales
- Cost differences by payment type
- Overall impact on margins
This is an area many operators overlook, yet it directly affects net cash flow.
How Power BI Brings Everything Together
A Power BI dashboard connects your operational and financial systems into a single, reliable view.
Using Power BI visualization, you can bring together:
- POS systems
- Fuel management data
- Accounting records
- Bank transactions
This creates a consistent and reliable source of truth across your business.
Operators who combine dashboards with finance automation often see immediate improvements in both visibility and control.
Multi-Location Benchmarking: The Real Advantage
If you operate multiple gas stations and convenience stores, comparing performance across locations becomes critical.
A well-built dashboard allows you to:
- View store performance side by side
- Identify underperforming locations quickly
- Apply consistent KPIs across all sites
This is particularly valuable when managing a convenience store and gas station portfolio across multiple states, especially if you are evaluating expansion or a gas station and convenience store for sale in North Carolina or Pennsylvania.
From Data to Decisions: The CFO Layer
Dashboards provide visibility, but interpretation is what drives results.
Virtual CFO support is really helpful, in this situation.
A CFO helps you:
- Look at the numbers. Figure out what they really mean to you
- Spot trends early to avoid problems.
- Make choices, about prices, staff numbers and business growth.
Many operators evaluating gas stations and convenience stores for sale rely on this level of insight before making investment decisions.
Compliance and Structural Considerations
For a dashboard to be reliable, it must be built on a strong financial foundation.
This includes:
- A chart of accounts aligned with NAICS code for gas station and convenience store or the correct activity code for gas station and convenience store
- Clear separation between fuel and inside store revenue
- Accurate tracking of taxes and fees
Without this structure, even the best dashboard can produce misleading insights.
Specialized gas station and convenience stores bookkeeping should be in place before building dashboards, for gas station and convenience stores.
To really get it you should look at Accounting for Convenience Store Operations, within Gas Stations: Managing Dual Revenue Streams.
Common Dashboard Mistakes to Avoid
Many dashboards fail due, to design, not technology issues.
Common issues include:
- Tracking too many metrics without clear priorities
- Ignoring fuel variance and shrinkage
- Infrequent data updates
- Inconsistent reporting across locations
Keeping your dashboard focused and consistent ensures it remains useful for you.
Practical Use Case: Weekly Dashboard Review
A simple weekly review process can really help you manage your business better.
Step 1: Review Fuel Margins
Look for pricing trends and opportunities to adjust
Step 2: Analyze Store Performance
Compare results across locations and categories
Step 3: Evaluate Labor Efficiency
Align staffing with actual sales patterns
Step 4: Review Cash Variances
Investigate and resolve discrepancies quickly
Step 5: Plan the Week Ahead
Make clear, data-driven decisions
This consistent routine helps turn information into action.
Tax and Financial Implications
Structured dashboards also support better financial and tax outcomes.
They help you:
- Identify deductible expenses more clearly
- Track taxable revenue accurately
- Prepare cleaner financial statements
Tax filing and year-end reporting are times when this is really important to do.
To get help you can look at Maximizing Tax Deductions and Credits for Retail Stores and Tax Planning Strategies, for Retail Stores.
How Crownglobe Helps Build the Right Dashboard
Crownglobe supports gas station and convenience store owners with integrated financial solutions, including:
- Power BI dashboard development
- Virtual CFO services
- Finance automation
- Bookkeeping and outsourced accounting
- Financial statements preparation
The focus is practical and results driven. You gain the clarity needed to make better decisions faster.
Conclusion
Running a gas station and convenience store successfully is about being clear and consistent, especially for operators who manage multiple locations.
You get to control your money when you know which numbers are important, and you look at them all the time like your cash flow.
A well-designed Power BI dashboard gives you that visibility.
Combined with CFO guidance, it becomes a powerful tool to improve profitability and support long-term growth.
FAQ Section
What KPIs should a gas station and convenience store track?
Key KPIs include fuel margin per gallon, inside store gross margin, labor cost percentage, cash over or short, and card fee impact.
How often should dashboards be reviewed?
Weekly reviews are recommended to respond quickly to changes in fuel pricing, sales, and operating costs.
Is Power BI suitable for small gas station owners?
Yes. Even single-location operators benefit from dashboards that simplify financial visibility and decision-making.
Do dashboards replace bookkeeping?
No. Dashboards depend on accurate bookkeeping and structured financial data.
Can dashboards help when buying a gas station?
Yes. They provide clear insight into performance trends, which is valuable when evaluating gas stations and convenience stores for sale.
How is a gas station and convenience store structured for financial reporting?
A gas station and convenience store is typically structured with separate revenue tracking for fuel and in-store sales, aligned with NAICS or activity codes to ensure accurate reporting and compliance.