Managing a gas station and convenience store is different from owning locations. When you expand to states like Georgia and Tennessee things get more complicated. You have to deal with sites and it’s harder to keep track of everything. A single site is easy to manage. Multiple locations, like, in Georgia and Tennessee add complexity.
You are no longer just tracking daily sales. You compare performance across locations to find gaps and make decisions in various environments that differ by market, cost, and how customers behave.
Most operators already have access to the data. What is often missing is clarity.
This is where multi-location benchmarking through Power BI becomes helpful; it brings all your data together so you can check performance across all locations, in one place. Make smart financial decisions with confidence using Power BI for multi-location benchmarking.
Why Multi-Location Visibility Matters
When you operate convenience stores and gas stations, convenience stores and gas stations do not perform exactly the same at every location.
Some stores do well while others slowly lose sales without us noticing, and it’s hard to see these differences, without data.
Common challenges include:
- No consistent method to compare store performance
- Delayed or fragmented reporting across locations
- Lack of clearly defined and standardized KPIs
- Difficulty identifying underperforming stores early
Whether you operate in Georgia, Tennessee or, across states the lack of visibility limits your ability to scale profitably.
Using a benchmarking approach brings all locations onto the same financial framework, which makes the performance differences of the locations clear and easy to act on.
What Is Multi-Location Benchmarking
Multi-location benchmarking compares performance metrics across all stores using a consistent structure.
You evaluate stores side by side to get an understanding of the store’s overall performance.
Key Metrics to Benchmark
For a gas station and convenience store key performance indicators are sales revenue, customer traffic, fuel volume and in-store sales:
- Fuel margin per gallon
- Inside store gross margin
- Labor cost percentage
- Sales per labor hour
- Card fee impact
- Cash over or short trends
These metrics give an clear view of how each location is actually performing.
Operators who run convenience stores and gas stations need this kind of information to make decisions, about how to operate and manage money for the convenience stores and gas stations.
Why Traditional Reports Fall Short
Many operators still use spreadsheets or month-end reports to see how the company is doing like checking how well the business is performing.
The problem is not that we do not have data it is how the data is structured and presented that is the real issue.
Traditional reports often:
- Present data in isolation without context
- Lack real-time updates
- Make cross-location comparison difficult
- Require significant manual interpretation
This leads to delayed decision-making because issues are often identified after they have already impacted the companys profitability.
How Power BI Transforms Benchmarking
Power BI visualization really changes how you work with your business data.
You get to see dashboards that show you all the locations, in a simple way instead of just looking at static reports.
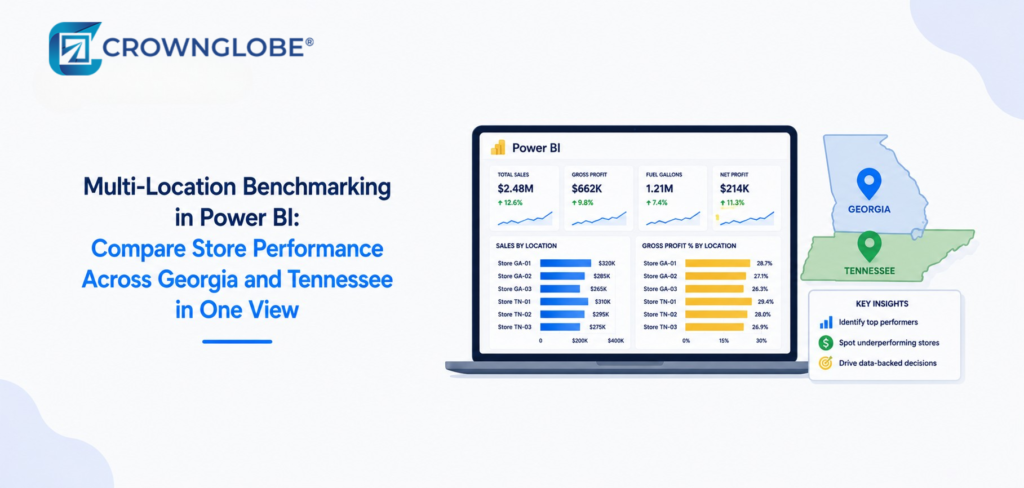
What a Power BI Dashboard Can Show
- Store-by-store performance comparisons
- Daily and weekly performance trends
- Category-level profitability insights
- Fuel margin fluctuations
- Labor efficiency across locations
This makes a single source of truth for your whole operation.
When finance automation and data updates work together, you get updates and can monitor performance right away.
Real-World Example: Georgia vs Tennessee Stores
Consider a business operating locations in both Georgia and Tennessee.
At a high level, total revenue across both states may appear similar. However, benchmarking often reveals important differences beneath the surface:
- One state may deliver stronger fuel margins but weaker inside store sales
- Another may experience higher labor costs that impact overall profitability
- Card fee impact may vary depending on local customer payment behavior
Without benchmarking, these patterns remain hidden.
You can use a Power BI dashboard to find the differences and take action on the Power BI dashboard.
From Data to Decisions: The CFO Layer
Data alone does not improve performance. Insight and interpretation are what drive results.
This is where a virtual CFO adds significant value.
A CFO helps you:
- Understand why certain locations outperform others
- Identify trends before they become operational issues
- Make informed pricing and staffing decisions
- Plan expansion based on reliable financial data
This becomes especially important when evaluating a gas station and convenience store for sale in Florida, a gas station and convenience store for sale in NJ, or a gas station and convenience store for sale in Pennsylvania or North Carolina as you expand into new markets.
Benchmarking provides the visibility. A CFO ensures that visibility leads to meaningful action.
Standardizing Financial Structure Across Locations
For benchmarking to deliver accurate insights, your financial data must be consistent across all locations.
This requires a standardized structure.
Key Requirements
- A chart of accounts aligned with NAICS code for gas station and convenience store and the appropriate activity code for gas station and convenience store
- Clear separation of fuel and inside store revenue
- Consistent expense categorization across all locations
- Accurate tracking of taxes and fees
Without this foundation, comparisons can be misleading.
This is why specialized gas station and convenience stores bookkeeping should be established before building dashboards.
For a deeper understanding, refer to Accounting for Convenience Store Operations within Gas Stations: Managing Dual Revenue Streams, which explains how to manage dual revenue streams effectively.
Identifying Underperforming Locations
Benchmarking allows you to quickly identify performance gaps across your portfolio.
You can clearly see:
- Locations with lower fuel margins
- Stores with higher-than-expected labor costs
- Sites showing unusual cash discrepancies
- Underperformance in inside store sales
This enables targeted action rather than guesswork.
For operators evaluating gas stations and convenience stores for sale, this level of insight is critical before making investment decisions.
Multi-State Complexity and Compliance
Operating convenience stores and gas stations in states like Georgia, Tennessee and Florida is complicated because convenience stores and gas stations must deal with different rules, in different places.
You must manage:
- Different sales tax regulations
- Motor fuel tax requirements
- Payroll compliance across jurisdictions
- Insurance requirements such as Florida gas station and convenience store insurance
A structured financial system is very helpful because it makes sure everything is done correctly. It also helps to keep track of how well the financial system is performing.
Common Benchmarking Mistakes to Avoid
Even, with tools benchmarking fails if not done correctly.
Common mistakes include:
- Comparing inconsistent or unstandardized data
- Tracking too many KPIs without clear priorities
- Overlooking fuel variance and shrinkage
- Failing to update dashboards regularly
- Lack of consistency across locations
Avoiding these issues ensures that your benchmarking remains practical and actionable.
Practical Weekly Benchmarking Process
A simple weekly routine can significantly improve decision-making:
Step 1: Review Fuel Margins
Compare margins across all locations
Step 2: Analyze Store Performance
Identify top and underperforming stores
Step 3: Evaluate Labor Efficiency
Adjust staffing based on performance trends
Step 4: Check Variances
Investigate discrepancies promptly
Step 5: Plan Actions
Set clear priorities for the upcoming week
This approach helps turn data into improvements that we can measure and see every time with the data.
Tax and Financial Considerations
Benchmarking also strengthens your financial and tax processes.
It helps you:
- Identify deductible expenses with greater accuracy
- Track revenue across multiple locations clearly
- Prepare cleaner and more reliable financial statements
Tax filing and year-end reporting for taxes is when this becomes particularly important, for tax filing and year-end reporting.
For help check out Maximizing Tax Deductions and Credits for Retail Stores and Tax Planning Strategies, for Retail Stores.
How Crownglobe Supports Multi-Location Operators
Crownglobe provides integrated financial solutions designed specifically for gas station and convenience store owners:
- Power BI dashboard development
- Virtual CFO services
- Finance automation
- Bookkeeping and outsourced accounting
- Financial statements preparation
- Payroll processing and compliance
The focus is practical and results-driven, helping you gain clarity and improve performance across every location.
Conclusion
Managing multiple gas stations and convenience stores or a growing convenience store and gas station portfolio requires more than tracking individual store performance.
It requires clear visibility across your entire operation.
Multi-location benchmarking with Power BI gives you visibility helps compare performance, find gaps, and make smart decisions with confidence using Power BI.
You can move from management to structured and scalable growth with the right systems and guidance, from a Chief Financial Officer.
FAQ Section
What is multi-location benchmarking for gas stations?
It is the process of comparing performance metrics across multiple gas stations and convenience store locations to identify strengths and areas for improvement.
Why is benchmarking important for multi-location operators?
It helps identify underperforming stores, improve operational efficiency, and support better financial decisions.
What tools are used for benchmarking?
Power BI dashboards are widely used to visualize and compare performance across multiple locations.
How often should benchmarking be reviewed?
Weekly reviews are recommended to respond quickly to performance changes.
Can benchmarking help when buying a gas station?
Yes. It provides valuable insight into performance trends when evaluating gas stations and convenience stores for sale.